
For developers, designers, and QA engineers working in the Apple ecosystem, “Inspect Element” is more than just a tool for peeking at HTML code; it is a command center for debugging, styling, and optimizing digital experiences. While most users know the basics of right-clicking to view source code, the Mac offers a unique set of powerful developer tools, particularly within Safari, that can significantly speed up your workflow.
Whether you are debugging a complex layout issue, trying to inspect an element on a Mac, or auditing a site for mobile responsiveness, mastering these advanced techniques will elevate your skills from casual observer to power user.
Unlocking the Tools: The First Step
Before diving into advanced tricks, you must ensure your environment is set up correctly. Unlike Chrome or Firefox, where the tools are often active by default, Safari on Mac requires a quick configuration to reveal its true power.
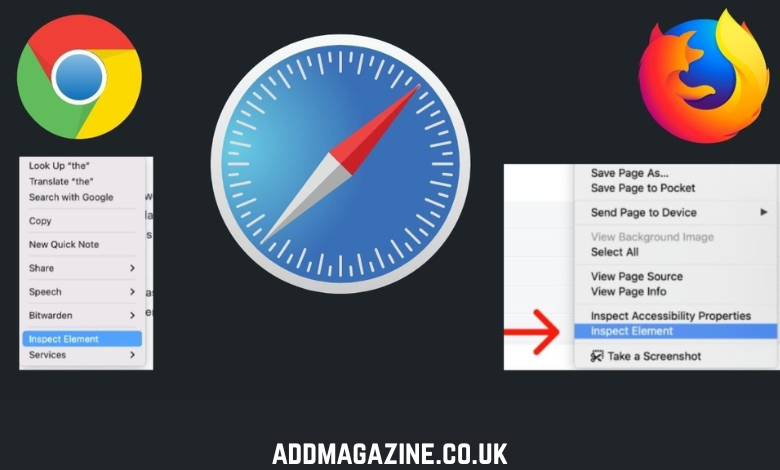
- For Safari Users: You won’t see the option to inspect anything until you enable the developer menu. Go to Safari > Settings (or Preferences) > Advanced and check the box that says “Show features for web developers” (or “Show Develop menu in menu bar” on older macOS versions).
- For Chrome/Firefox Users: The feature is native. You can simply right-click any part of a page and select “Inspect” or use the universal shortcut.
Pro Shortcut: Memorize Cmd + Option + I. This works across Safari, Chrome, and Firefox on Mac to instantly open the Developer Tools panel.
1. Master the “Force State” for Interactive Elements
One of the most frustrating aspects of front-end debugging is inspecting an element that changes when you move your mouse, such as a hover effect, tooltip, or dropdown menu. As soon as you move your cursor to the inspector, the element disappears.
The Pro Tip: In the Elements panel (or DOM tree), right-click the HTML element you want to freeze. Search for the “Force State” option in Safari or Chrome to lock interactive elements in place for debugging. select :hover, :active, or :focus. This forces the browser to render the element as if the user were interacting with it, allowing you to tweak the CSS without fighting a disappearing menu.
2. Simulate Slow Networks for Performance Audits
Your website might load instantly on your high-speed office Wi-Fi, but how does it perform on a spotty 3G connection? You don’t need a tunnel to test this.
The Pro Tip:
- In Safari: Go to the Network tab in the Web Inspector. Look for the icon that resembles a speedometer, or the “No Throttling” dropdown. Select a preset, such as “3G,” or create a custom profile.
- In Chrome: Open the Network tab, find the “No throttling” dropdown, and switch to “Slow 3G.”
This is crucial for identifying significant assets that block rendering and ensuring your loading states (like spinners or skeletons) appear correctly for users with slower connections.
3. Advanced Responsive Design Mode
Manually resizing your browser window is an inaccurate way to test responsiveness. Mac browsers offer dedicated modes that simulate specific device viewports and user agent strings.
The Pro Tip: In Safari, press Cmd + Ctrl + R to enter Responsive Design Mode. This doesn’t just resize the screen; it also lets you simulate different iOS devices (like iPhone SE or iPad Pro) and even distinct pixel ratios (1x, 2x, 3x). This is the standard method for those learning how to inspect elements on Mac to verify mobile layouts without needing physical devices for every single resolution.
4. Debugging JavaScript with Breakpoints
Stop using console.log() for everything. The “Sources” (Chrome) or “Debugger” (Safari) tab allows you to pause code execution at specific lines.
The Pro Tip: Click the line number in your JavaScript file within the inspector to set a breakpoint. When the browser executes that line, the page will freeze. You can then hover over variables to see their current values in real-time, step through the code line-by-line, and identify precisely where the logic fails.
5. Bridging the Gap: Inspecting Mobile Contexts
One of the most powerful features of the Mac ecosystem is the ability to inspect content running on an external iOS device. This is a critical skill for iOS app testing, particularly for hybrid apps or mobile web views.
Pro Tip: Connect your iPhone or iPad to your Mac with a cable. Enable “Web Inspector” on your iOS device (Settings > Safari > Advanced). Now, open Safari on your Mac and look for the Develop menu in the top bar. You will see your connected device listed there. Hovering over it will reveal the open browser tabs or web views running on the phone. Clicking one opens the full desktop Web Inspector for that specific mobile context, allowing you to debug mobile-specific issues using the comfort of your desktop keyboard and screen.
Conclusion and Next Steps
Mastering the Web Inspector on Mac allows you to diagnose CSS glitches, audit performance, and debug complex JavaScript without leaving your browser. However, while local inspection tools are excellent for initial debugging, they are limited to the devices you physically own and the local network conditions you can simulate.
For enterprise-grade quality assurance, especially when scaling iOS app testing across different regions and networks, you need a more robust solution. This is where HeadSpin makes a significant difference. HeadSpin provides a global device infrastructure that enables you to remotely inspect and test applications on thousands of real, SIM-enabled devices worldwide. Unlike local simulators, HeadSpin provides AI-driven performance insights. It captures critical data on user experience—such as video quality and audio playback—ensuring your app performs flawlessly not just on your local Mac, but for users everywhere.