
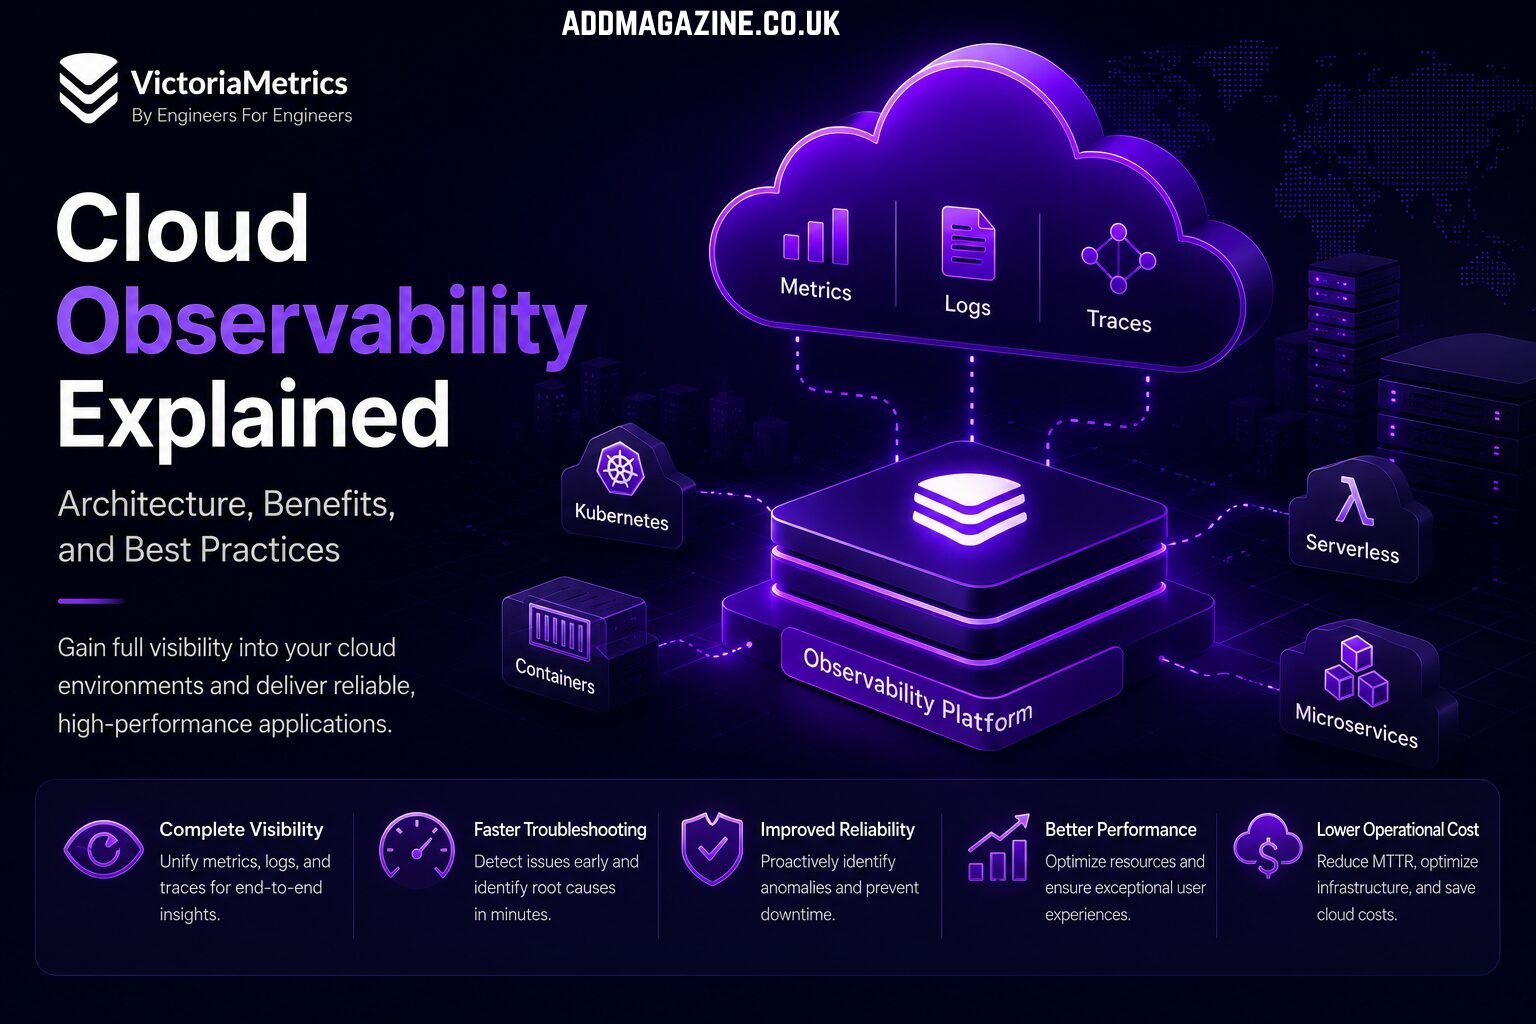
Cloud computing has transformed the way businesses build and deploy applications. Modern infrastructures now span multiple cloud providers, Kubernetes clusters, containers, serverless functions, and microservices. While these technologies provide incredible flexibility, they also introduce new monitoring challenges. Traditional monitoring tools often struggle to provide complete visibility across distributed systems, making cloud observability an essential part of every modern infrastructure strategy.
Cloud observability goes beyond basic monitoring by helping engineering teams understand not only what is happening across their environments but also why it’s happening. With complete visibility into metrics, logs, and traces, organizations can detect issues faster, improve application reliability, and deliver better user experiences.
Whether you’re running cloud-native applications or managing enterprise-scale infrastructure, implementing the right cloud observability strategy can significantly reduce downtime, improve operational efficiency, and simplify troubleshooting.
What Is Cloud Observability?
Cloud observability is the practice of collecting, analyzing, and correlating telemetry data from cloud environments to gain complete visibility into application and infrastructure performance.
Unlike traditional monitoring, which primarily focuses on predefined metrics and alerts, cloud observability enables teams to investigate unknown issues by analyzing multiple data sources together.
A complete cloud observability platform typically combines:
- Infrastructure metrics
- Application metrics
- Logs
- Distributed traces
- Events
- Alerts
By correlating these data sources, engineering teams can quickly identify root causes instead of spending hours investigating isolated alerts.
Modern observability software makes it possible to monitor everything from virtual machines and containers to Kubernetes clusters, databases, APIs, and cloud services within a unified platform.
Why Traditional Monitoring Is No Longer Enough
Today’s applications are far more dynamic than they were just a few years ago.
A single customer request may travel through dozens of microservices, containers, APIs, message queues, and cloud databases before returning a response. If performance issues occur anywhere along that path, traditional monitoring tools may only report that something is wrong—not where the problem actually exists.
This lack of visibility often leads to:
- Longer incident response times
- Increased operational costs
- Poor customer experiences
- Missed service-level objectives
- Alert fatigue
Cloud observability addresses these challenges by providing context rather than isolated metrics.
Instead of monitoring individual servers, teams gain visibility across entire distributed systems.
The Architecture of Cloud Observability
A successful cloud observability architecture consists of several interconnected components that continuously collect and analyze telemetry data.
Metrics Collection
Metrics provide numerical measurements describing the health and performance of systems.
Examples include:
- CPU utilization
- Memory consumption
- Network throughput
- Request latency
- Error rates
- Disk usage
These metrics allow engineering teams to monitor trends, create alerts, and identify performance bottlenecks before users are affected.
High-performance observability software should efficiently collect and store millions of metrics without compromising query speed.
Log Aggregation
Logs capture detailed records of application and infrastructure events.
Centralized logging allows engineers to:
- Investigate application errors
- Review deployment history
- Analyze authentication failures
- Troubleshoot production incidents
Rather than searching across multiple servers, cloud observability platforms centralize logs into a searchable database.
Distributed Tracing
Modern applications often consist of dozens of interconnected microservices.
Distributed tracing follows every request as it moves through these services, helping teams identify:
- Slow database queries
- Network latency
- API bottlenecks
- Failed service calls
- Performance degradation
Tracing dramatically reduces troubleshooting time by visualizing entire request paths.
Alerting
Observability platforms continuously evaluate collected telemetry against predefined thresholds.
Instead of alerting on every minor anomaly, intelligent alerting focuses on meaningful performance issues, reducing unnecessary notifications while improving incident response.
The Three Pillars of Cloud Observability
Most cloud observability strategies are built around three core pillars.
Metrics
Metrics provide high-level visibility into infrastructure and application health.
They answer questions like:
- Is CPU usage increasing?
- How many requests are failing?
- Is response time degrading?
Logs
Logs explain what happened inside applications and services.
They provide detailed diagnostic information that helps engineers understand failures beyond what metrics alone can reveal.
Traces
Rather than investigating individual services separately, traces reveal the complete journey of every request through your infrastructure.
Together, these three pillars provide the comprehensive visibility required for modern cloud operations.
Benefits of Cloud Observability
Organizations investing in cloud observability experience significant operational improvements.
Faster Incident Resolution
Instead of manually correlating metrics, logs, and traces from multiple systems, engineers access unified telemetry that quickly identifies root causes.
This reduces mean time to detection (MTTD) and mean time to resolution (MTTR).
Improved Application Reliability
Continuous visibility allows teams to identify performance issues before they impact customers.
Early detection helps maintain higher availability and better user experiences.
Better Resource Optimization
Cloud observability provides insights into infrastructure utilization.
Engineering teams can identify:
- Underutilized servers
- Oversized virtual machines
- Inefficient workloads
- Excessive storage consumption
This helps reduce unnecessary cloud spending while maintaining application performance.
Simplified Kubernetes Monitoring
Kubernetes environments constantly create and destroy workloads.
Traditional monitoring solutions often struggle to keep pace with these dynamic environments.
Cloud observability platforms automatically discover new workloads while continuously monitoring containers, pods, nodes, and clusters.
Better Decision Making
Historical telemetry enables organizations to analyze long-term trends.
Engineering teams can confidently plan:
- Capacity expansion
- Infrastructure upgrades
- Performance optimization
- Cost reduction initiatives
Best Practices for Cloud Observability
Implementing cloud observability requires more than deploying monitoring agents.
Following proven best practices ensures long-term success.
Collect Meaningful Metrics
Avoid collecting unnecessary telemetry that increases storage costs without providing operational value.
Focus on metrics directly related to system health, customer experience, and business objectives.
Centralize Observability Data
Metrics, logs, and traces should be stored within a centralized platform.
Unified data makes correlation significantly easier during incident investigations.
Monitor High-Cardinality Metrics Efficiently
Modern cloud-native applications generate enormous amounts of high-cardinality telemetry.
Choosing an efficient storage platform helps maintain performance while controlling infrastructure costs.
Automate Alerting
Create actionable alerts that focus on customer-impacting issues.
Reducing noisy alerts improves operational efficiency and prevents alert fatigue.
Use Open Standards
Building observability around standards like OpenTelemetry improves flexibility while avoiding vendor lock-in.
It also simplifies future integrations as your infrastructure evolves.
Choosing the Right Cloud Observability Platform
Not every observability platform is designed to handle modern cloud workloads.
As environments grow, organizations need solutions capable of storing billions of metrics while maintaining fast query performance and low operational costs.
This is where VictoriaMetrics stands out.
VictoriaMetrics is a high-performance observability platform built specifically for modern cloud-native environments. It provides efficient storage, excellent scalability, and seamless compatibility with Prometheus, Grafana, Kubernetes, and OpenTelemetry.
Whether deployed on-premises or in the cloud, VictoriaMetrics enables organizations to retain large volumes of monitoring data while reducing infrastructure costs through highly optimized storage and efficient resource utilization.
Its architecture supports everything from small development environments to enterprise-scale distributed infrastructures without introducing unnecessary operational complexity.
Final Thoughts
As cloud infrastructures continue to become more distributed and dynamic, traditional monitoring alone is no longer sufficient. Organizations require complete visibility into every layer of their applications, infrastructure, and services to maintain reliability and deliver exceptional user experiences.
Cloud observability provides that visibility by combining metrics, logs, and traces into a unified view of system health. With the right architecture, organizations can detect issues faster, optimize infrastructure, reduce operational costs, and improve application performance.
For teams looking to build a scalable observability strategy, VictoriaMetrics offers a powerful foundation. Its efficient storage engine, cloud-native architecture, and compatibility with leading open-source technologies make it an ideal choice for organizations seeking a modern cloud observability solution that grows alongside their infrastructure.